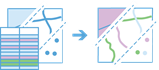
By subscribing to a vendor account, you get the full power of big data analytics across your datasets and selected 3rd party layers.
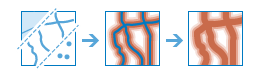
Patterns and relationships aren’t always obvious by looking at maps and complex datasets; often, there’s too much data to sift through to understand trends and relationships intuitively.
To get the most out of your data, our spatial analysis tools allow you to quantify patterns and relationships in the data and display the results as maps, tables, and charts. GeoReports’ spatial analysis tools empower you and your team to make quick, informed decisions.
Smart data tools and applied examples are grouped below by category:
Summarize data
These tools calculate total counts, lengths, areas, and basic descriptive statistics of features and their attributes within areas or near other features.
|
Tool |
Description |
|
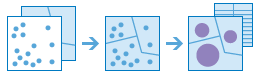
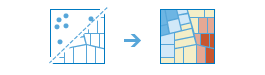
This tool works with a layer of point features and a layer of area features. It first figures out which points fall within each area. After determining this point-in-area spatial relationship, statistics about all points in the area are calculated and assigned to the area. The most basic statistic is the count of the number of points within the area, but you can get other statistics as well. |
|
|
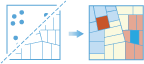
This tool transfers the attributes of one layer or table to another based on spatial and attribute relationships. Statistics can then be calculated on the joined features. For example: · Join key results of key chemical datasets to map geochemical hazards or constraints (i.e. pH+chloride+sulfate for durability classifications) · Undertake slope risk mapping by combining terrain, rainfall, soil types |
|
|
This tool finds features within a specified distance of features in the analysis layer. Distance can be measured as a straight-line distance or a selected travel mode. Statistics are then calculated for the nearby features. For example
|
|
|
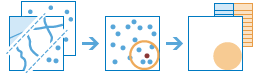
This tool finds the central feature, mean center, median center, or ellipse (directional distribution) of point features. For example, find the central feature or mean centre in a set of points, such as wells, contaminated sites, or ore bodies to optimise and target investigation or remediation works. |
Analyze patterns
These tools help you identify, quantify, and visualize spatial patterns in your data by identifying areas of statistically significant clusters.
|
Tool |
Description |
|
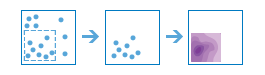
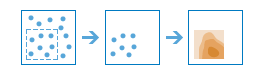
The Calculate Density tool creates a density map from point or line features by spreading known quantities of some phenomenon (represented as attributes of the points or lines) across the map. The result is a layer of areas classified from least dense to most dense. For Example: Calculating the concentration of chemical analytes based on hits or occurrence in a specified site. |
|
|
The Find Hot Spots tool will determine if there is any statistically significant clustering in the spatial pattern of your data. For example: rock or water levels to inform engineering, analysis and or design. |
|
|
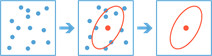
The Find Outliers tool will determine if there are any statistically significant outliers in the , spatial pattern of your data. For example, are there anomalous results in the pattern of your environmental Chemical dataset or instrumentation monitoring data? How can you be sure? |
|
|
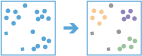
The Find Point Clusters tool finds clusters of point features within surrounding noise based on their spatial distribution. For example:
|
|
|
The Interpolate Points tool allows you to predict values at new locations based on measurements from a collection of points. The tool takes point data with values at each point and returns areas classified by predicted values. Ideal for contouring, water, rock, settlement or other surfaces, potentially combined with 3rd party datasets. For example
|
Find Locations
These tools find features that pass any number of criteria that you specify. They are typically used for site selection, where the objective is to find places that satisfy multiple criteria.
|
Tool |
Description |
|
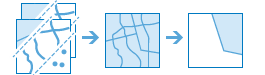
This tool selects existing features in your study area that meet a series of criteria you specify. These criteria can be based on attribute queries (for example, borehole depths, material occurrences, structure types) and spatial queries (for example, boreholes or instruments containing certain readings or within a certain distance from a feature). |
|
|
This tool derives new features in your study area that meet a series of criteria you specify. These criteria can be based on attribute queries (for example, sites that are not on soft ground) and spatial queries (for example, basements that are within flood zones). |
|
|
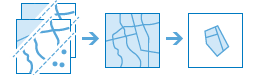
Based on criteria you specify, the Find Similar Locations tool measures the similarity of locations in your candidate search layer to one or more reference locations. |
|
|
This tool creates areas where an observer can see objects on the ground. The input analysis points can represent either observers (such as people on the ground or lookouts in a fire tower) or observed objects (such as wind turbines, water towers, vehicles, or other people). The result areas are those areas where the observers can see the observed objects and vice versa: the observed objects can see the observers. The output is typically used in site suitability and selection analysis. |
|
|
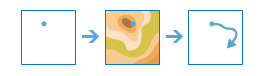
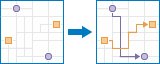
This tool determines the trace, or flow path, in a downstream direction from the points in your analysis layer. |
Use proximity
These tools help answer a common question posed in spatial analysis: What is near what?
|
Tool |
Description |
|
A buffer is an area that covers a given distance from a point, line, or area feature. Buffers are typically used to create areas that can be further analyzed using a tool such as Overlay Layers. For example, if the question is What boreholes are within 1km of the site? |
|
|
This tool finds the nearest features and, optionally, reports and ranks the distance to the nearby features. To find what’s nearby, the tool can either measure straight-line distance or a selected travel mode. There are options to limit the number of nearest features to find or the search range in which to find them. |
|
|
This tool measures the travel time or distance between pairs of points. The tool can report straight-line distances, road distances, or travel times. You provide starting and ending points, and the tool returns a layer containing route lines, including measurements, between the paired origins and destinations. If many origins go to one destination, a table summarizing multiple trips to the destination is included in the output. |
Manage data
These tools are used for both the day-to-day management of geographic data and for combining data prior to analysis.
|
Tool |
Description |
|
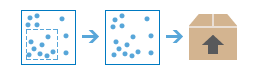
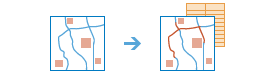
With this tool, you can select and download data for a specified area of interest. Layers that you select will be added to a ZIP file or layer package. |
|
|
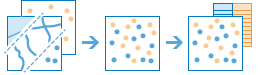
This tool copies features from 2 layers into a new layer. The layers to be merged must all contain the same feature types (points, lines, or areas). You can control how the fields from the input layers are joined and copied. For example:
|
|
|
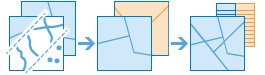
Overlay Layers combines 2 or more layers into 1 single layer. You can think of overlay as peering through a stack of maps and creating a single map containing all the information found in the stack. In fact, before the advent of GIS, cartographers would literally copy maps onto clear acetate sheets, overlay these sheets on a light table, and hand draw a new map from the overlaid data. Overlay is much more than a merging of line work; all the attributes of the features taking part in the overlay are carried through to the final product. Overlay is used to answer one of the most basic questions of geography: What is on top of what? For example
|